2023Python程序设计--期末大作业
2023Python程序设计–期末大作业
任务一
抓取链家官网北上广深4个一线城市和天津的租房数据。应获取每个城市的全部租房数据(一线城市的数据量应该在万的数量级)。
分析
以北京为例,书写报告时北京房子总数为66187套,而链家只允许查看前100页(共3000套)租房信息。所以,我们需要细化条件使得每个条件下住房信息少于100页。解决方法是按照市辖区进行区分,这样均小于100页
因此,可以分两步进行:
将所有市辖区爬取下来
按照市辖区组合爬取住房信息
代码
以北京为例,其余地区与北京相似:
1 | import scrapy |
1 | import scrapy |
1 | from itemadapter import ItemAdapter |
任务二
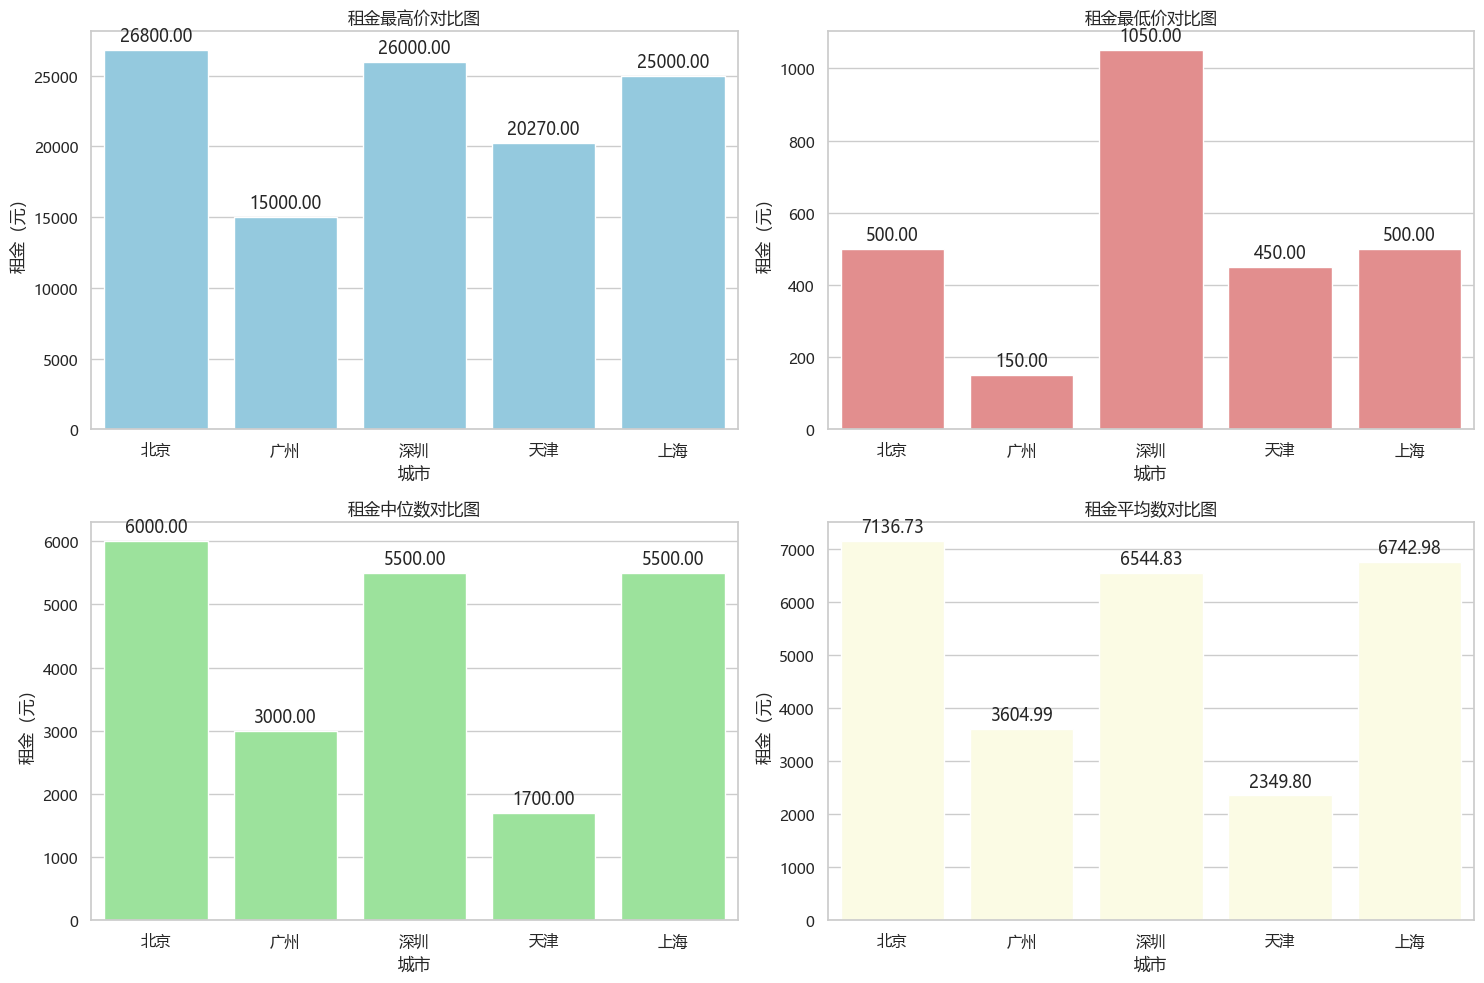
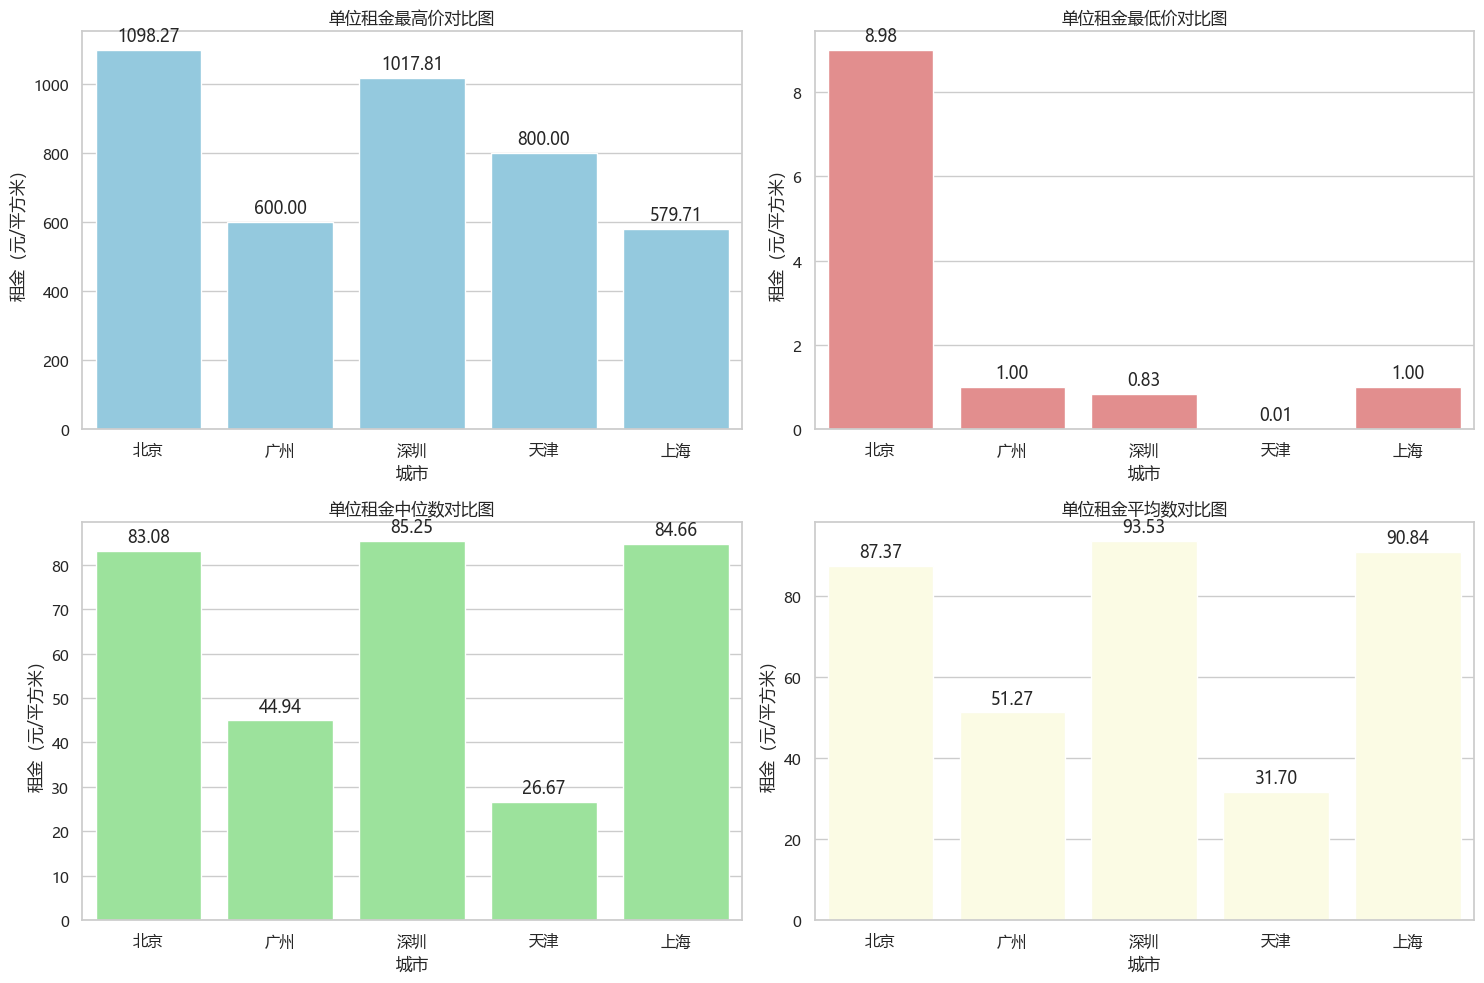
比较5个城市的总体房租情况,包含租金的均价、最高价、最低价、中位数等信息,单位面积租金(元/平米)的均价、最高价、最低价、中位数等信息。采用合适的图或表形式进行展示。
分析
获取到所有爬取数据后,简单画图发现其中存在一些极大值(100k+)和极小值(100-),这些数据很明显会对图产生较大影响,因此需要去除超过两倍标准差的数据
代码
1 | # 北京租金的均价、最高价、最低价、中位数计算;单位面积租金(元/平米)的均价、最高价、最低价、中位数等信息 |
1 | # 广州租金的均价、最高价、最低价、中位数计算;单位面积租金(元/平米)的均价、最高价、最低价、中位数等信息 |
1 | # 深圳租金的均价、最高价、最低价、中位数计算;单位面积租金(元/平米)的均价、最高价、最低价、中位数等信息 |
1 | # 上海租金的均价、最高价、最低价、中位数计算;单位面积租金(元/平米)的均价、最高价、最低价、中位数等信息 |
1 | # 天津租金的均价、最高价、最低价、中位数计算;单位面积租金(元/平米)的均价、最高价、最低价、中位数等信息 |
1 | data = { |
1 | # 将数据组织成一个字典 |
任务三
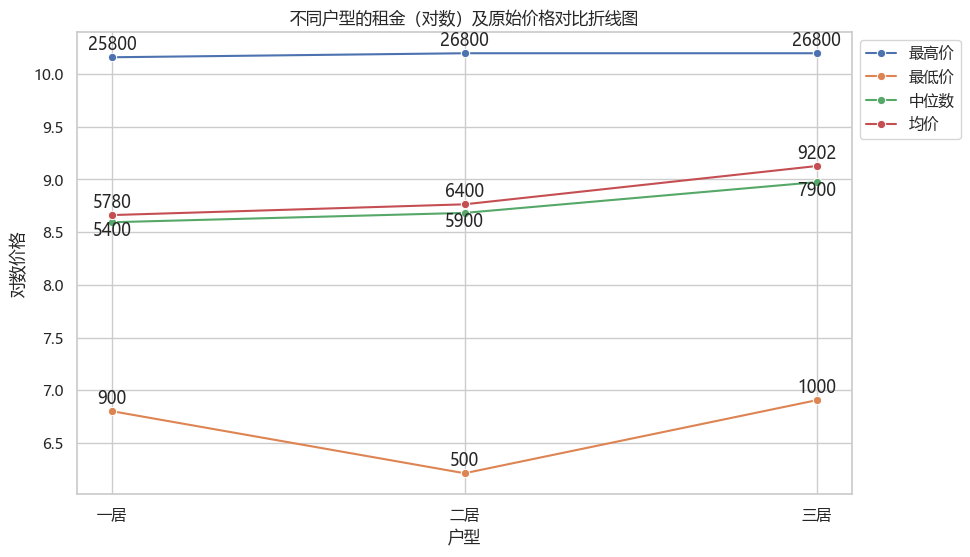
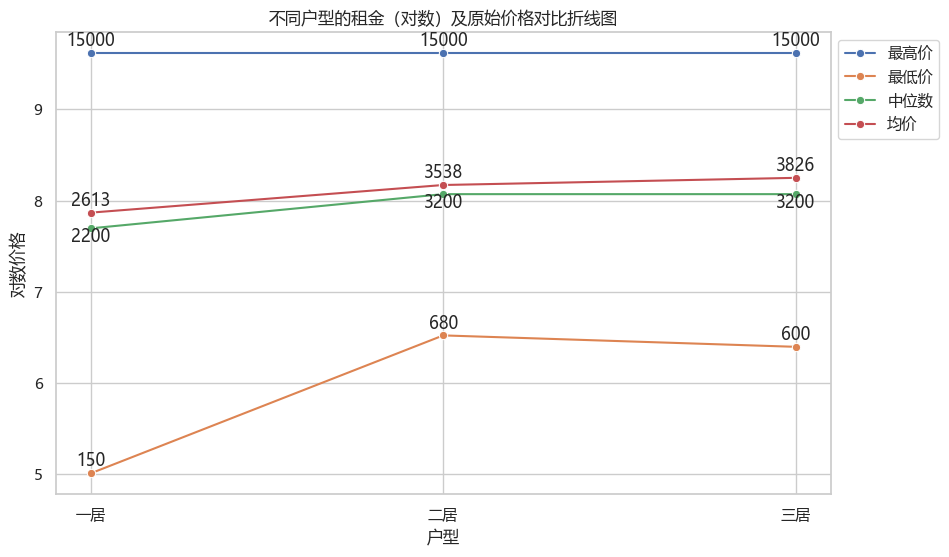
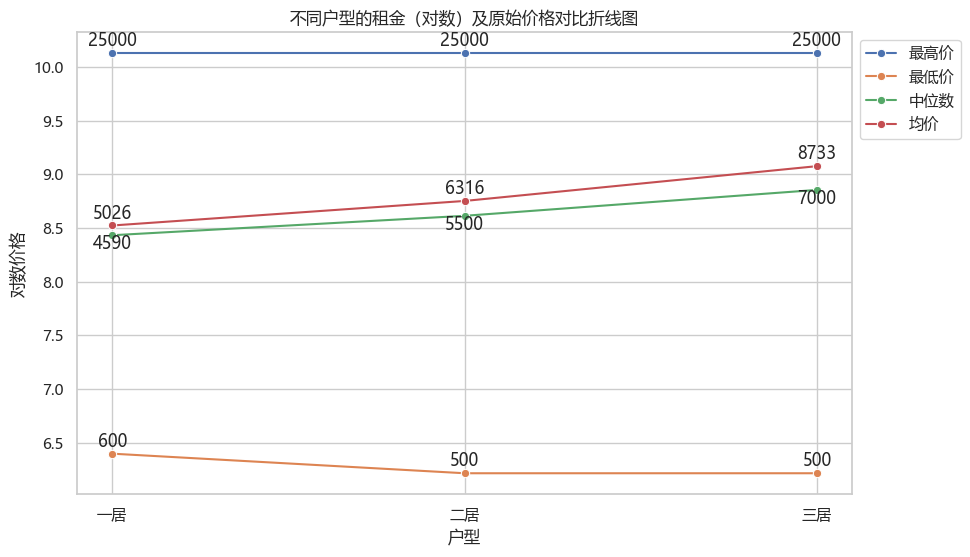
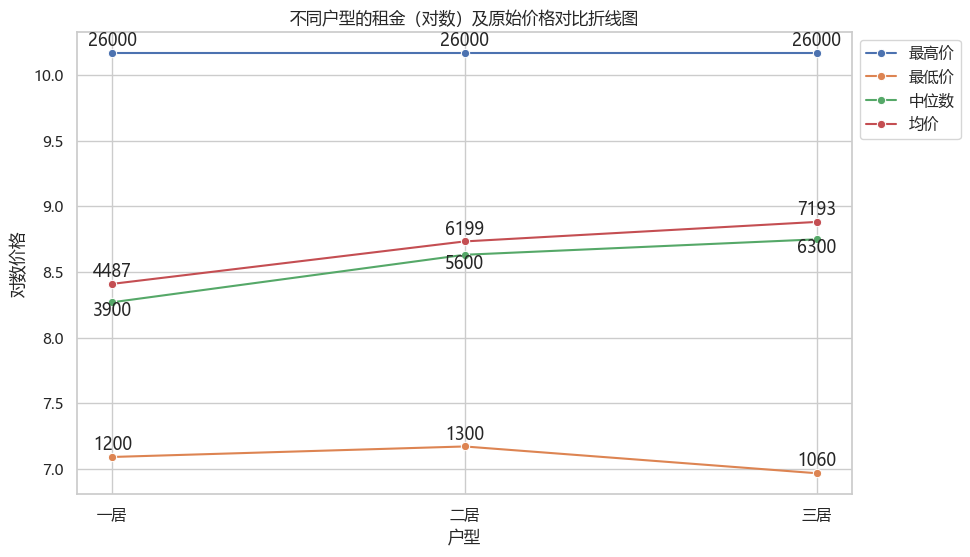
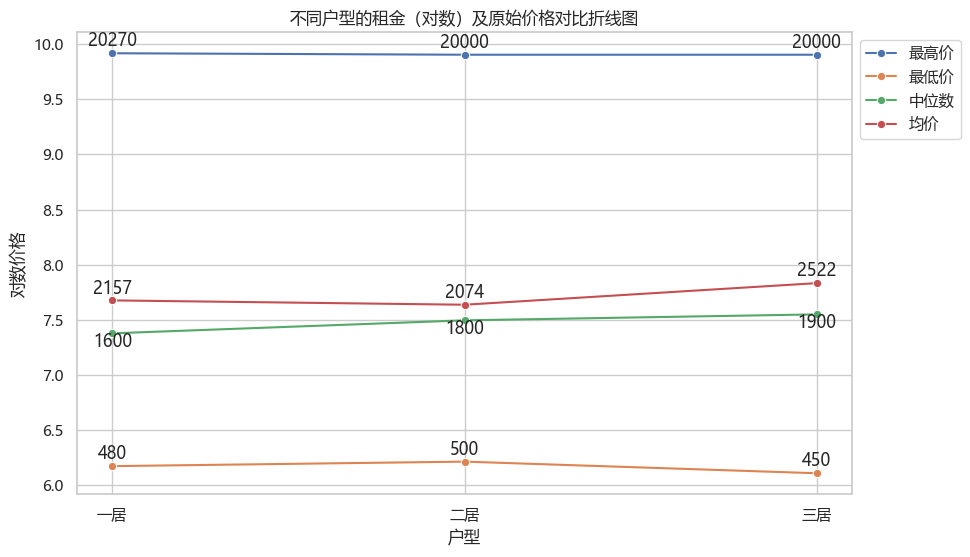
比较5个城市一居、二居、三居的情况,包含均价、最高价、最低价、中位数等信息,采用合适的图或表形式进行展示。
分析
由于最高价和最低价差距较大,因此需要采用对数价格
代码
1 | # 北京一居、二居、三居的均价、最高价、最低价、中位数等信息 |
1 | # 广州一居、二居、三居的均价、最高价、最低价、中位数等信息 |
1 | # 上海一居、二居、三居的均价、最高价、最低价、中位数等信息 |
1 | # 深圳一居、二居、三居的均价、最高价、最低价、中位数等信息 |
1 | # 天津一居、二居、三居的均价、最高价、最低价、中位数等信息 |
任务五
计算和分析每个城市不同板块的均价情况,并采用合适的图或表形式进行展示。
代码
1 | # 转换为 DataFrame |

1 | # 转换为 DataFrame |

1 | # 转换为 DataFrame |

1 | # 转换为 DataFrame |

1 | # 转换为 DataFrame |

任务六
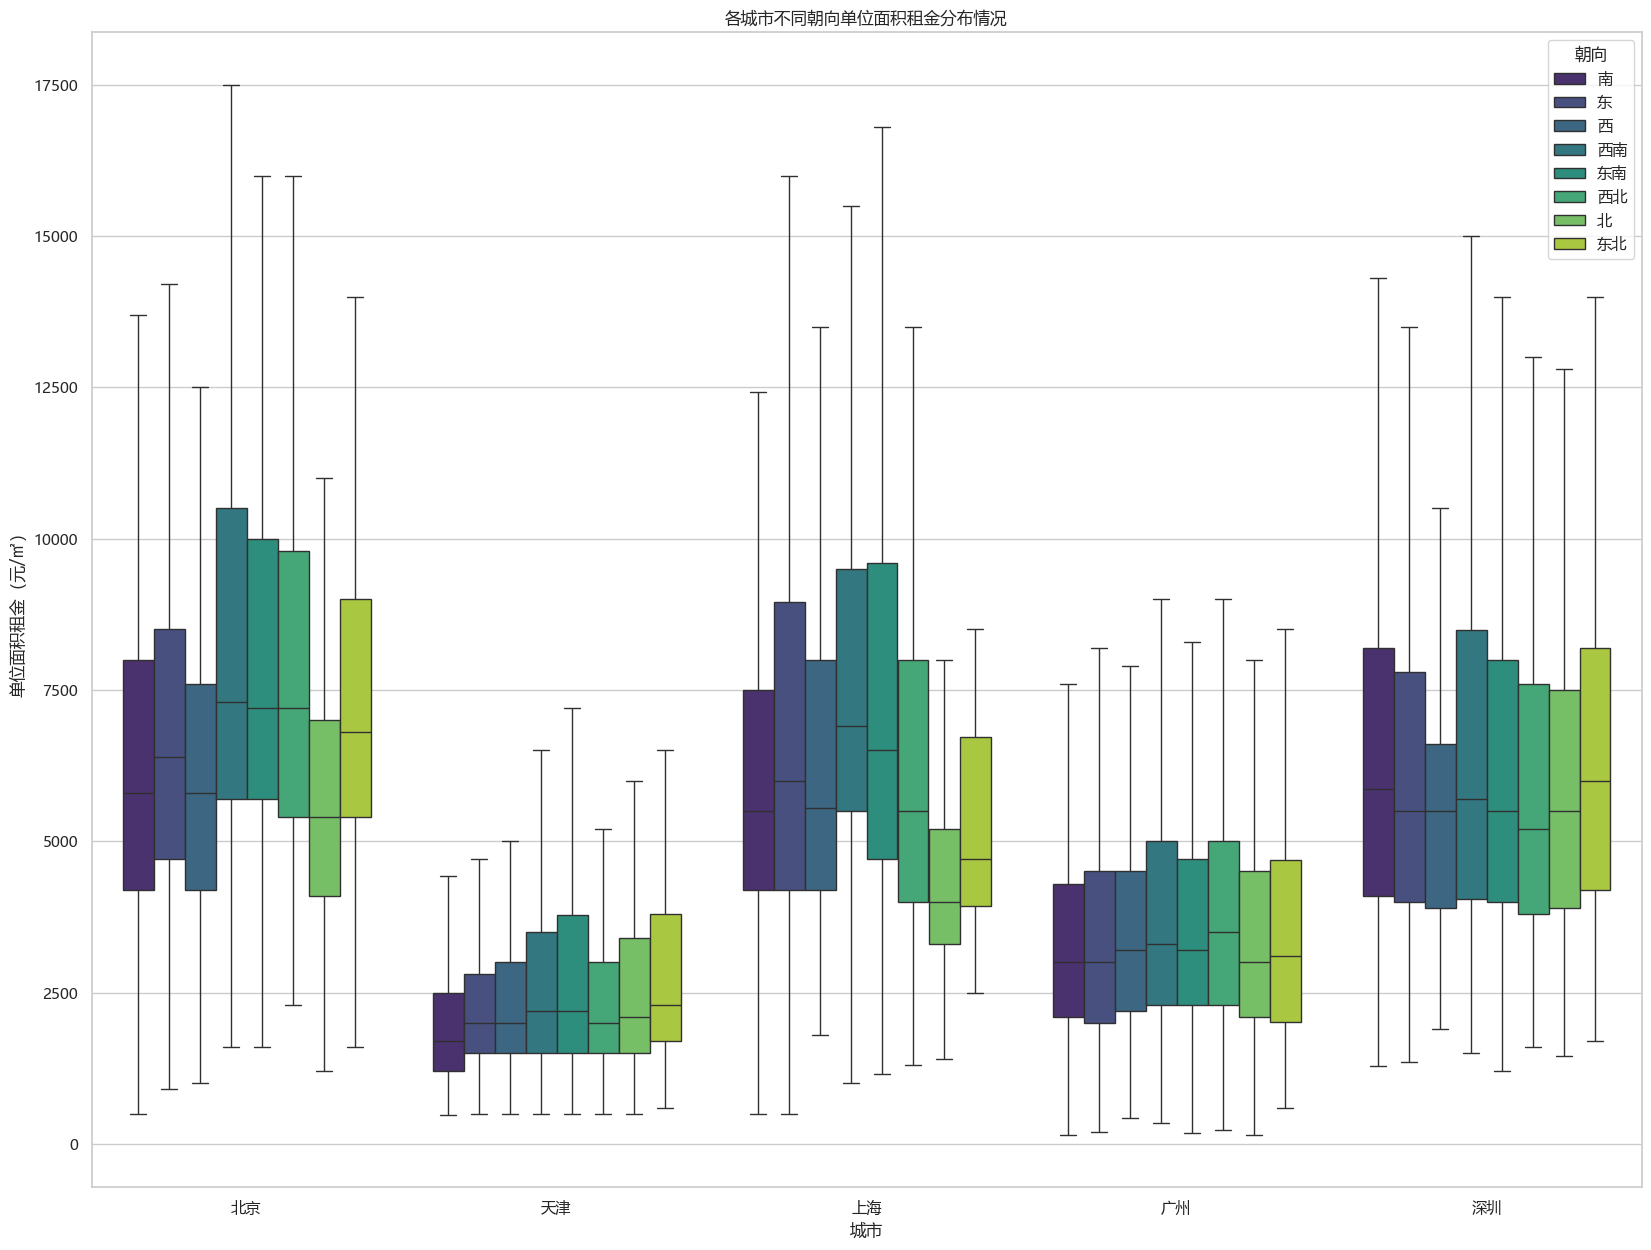
比较各个城市不同朝向的单位面积租金分布情况,采用合适的图或表形式进行展示。哪个方向最高,哪个方向最低?各个城市是否一致?如果不一致,你认为原因是什么?
分析
由箱线图可知,北京东南方单位面积租金最高,北方最低;天津东北方单位面积租金最高,南方最低;上海东南方单位面积租金最高,北方最低;广州比较均匀;深圳西南方最高,东南方最低。
原因可能有以下几点:
地理位置: 不同城市的地理位置可能对朝向的单位面积租金产生影响。例如,面朝城市繁华区或拥有良好景观的方向可能更受欢迎,从而推高租金。
经济发展: 不同城市的经济状况和发展水平不同,可能导致不同朝向的单位面积租金存在差异。朝向经济繁荣区的方向可能租金较高。
交通便利性: 朝向交通便利的方向可能更受租户青睐,从而影响租金水平。
景观和环境: 朝向有良好景观或较好环境的方向可能租金较高,因为人们更倾向于选择居住在宜人的环境中。
区域规划: 城市规划和开发策略可能会影响不同方向的发展速度和吸引力,从而影响租金水平。
人口密度: 不同方向的人口密度和社会经济特征可能影响租金水平。高密度地区可能更容易找到租客,推高租金。
房屋品质和设施: 不同方向的房屋品质和设施可能存在差异,从而影响租金水平。
代码
1 | # 将 JSON 数据转换为各地区的 DataFrame |
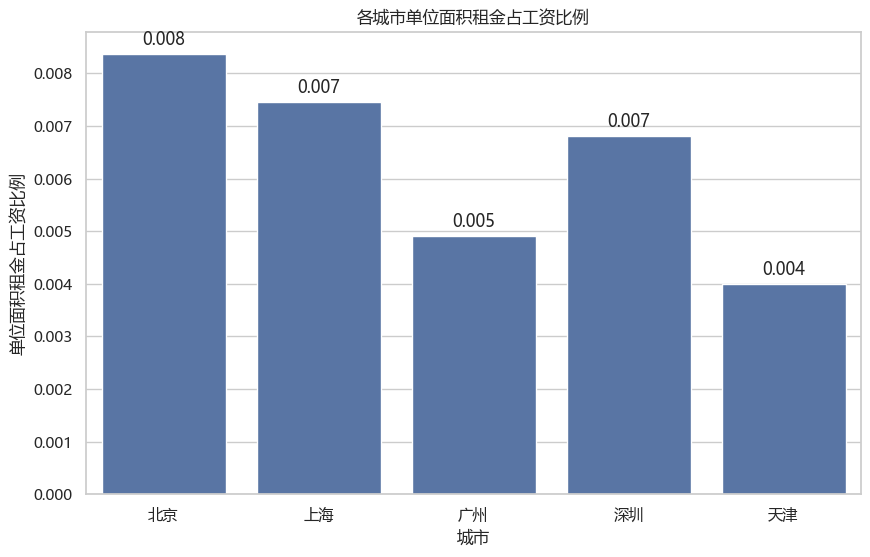
任务七
查询各个城市的平均工资,分析并展示其和单位面积租金分布的关系。比较一下在哪个城市租房的负担最重?
分析
由图可知,北京压力最大
代码
1 | ''' |
任务八
与2022年的租房数据进行对比(只比较北上广深4个城市,原始数据会给出),总结你观察到的变化情况,并用图、表、文字等支撑你得到的结论。
分析
对比了各个市辖区在一年之类租金平均价格的变化。可以看出北京和上海某些地段价格变化十分明显
代码
1 | df_2022 = pd.DataFrame(json.loads(open('ShanghaiHouseInfo.json',encoding='gbk').read())) |

1 | df_2022 = pd.DataFrame(json.loads(open('BeijingHouseInfo.json',encoding='utf-8').read())) |

1 | df_2022 = pd.DataFrame(json.loads(open('GuangzhouHouseInfo.json',encoding='utf-8').read())) |
